


Monitoring your business is vital. As the management guru Peter Drucker once said, "If you can't measure it, you can't improve it." Fortunately, Prometheus is a cloud-native monitoring tool that can help you measure and improve your business operations. In this blog post, we'll explore the benefits of Prometheus, how it works, and how you can get started using it.
Overview
Prometheus is at the heart of the modern open-source observability stack. It's a time-series database that enables you to collect and analyze metrics from your entire infrastructure. With Prometheus, you can gather data across all of your services, finding new ones via service discovery as they are deployed. Every data source that you want to scrape has some *-exporter package that you can run to connect to it and get its data into Prometheus. This includes all of the Kubernetes components you can imagine, whatever database you use (PostgreSQL, MySQL, SQL Server, etc), your key-value stores, your Slack workspace...seriously, if you use a thing, someone's likely written a prometheus exporter for it.
Here's a diagram of its architecture:
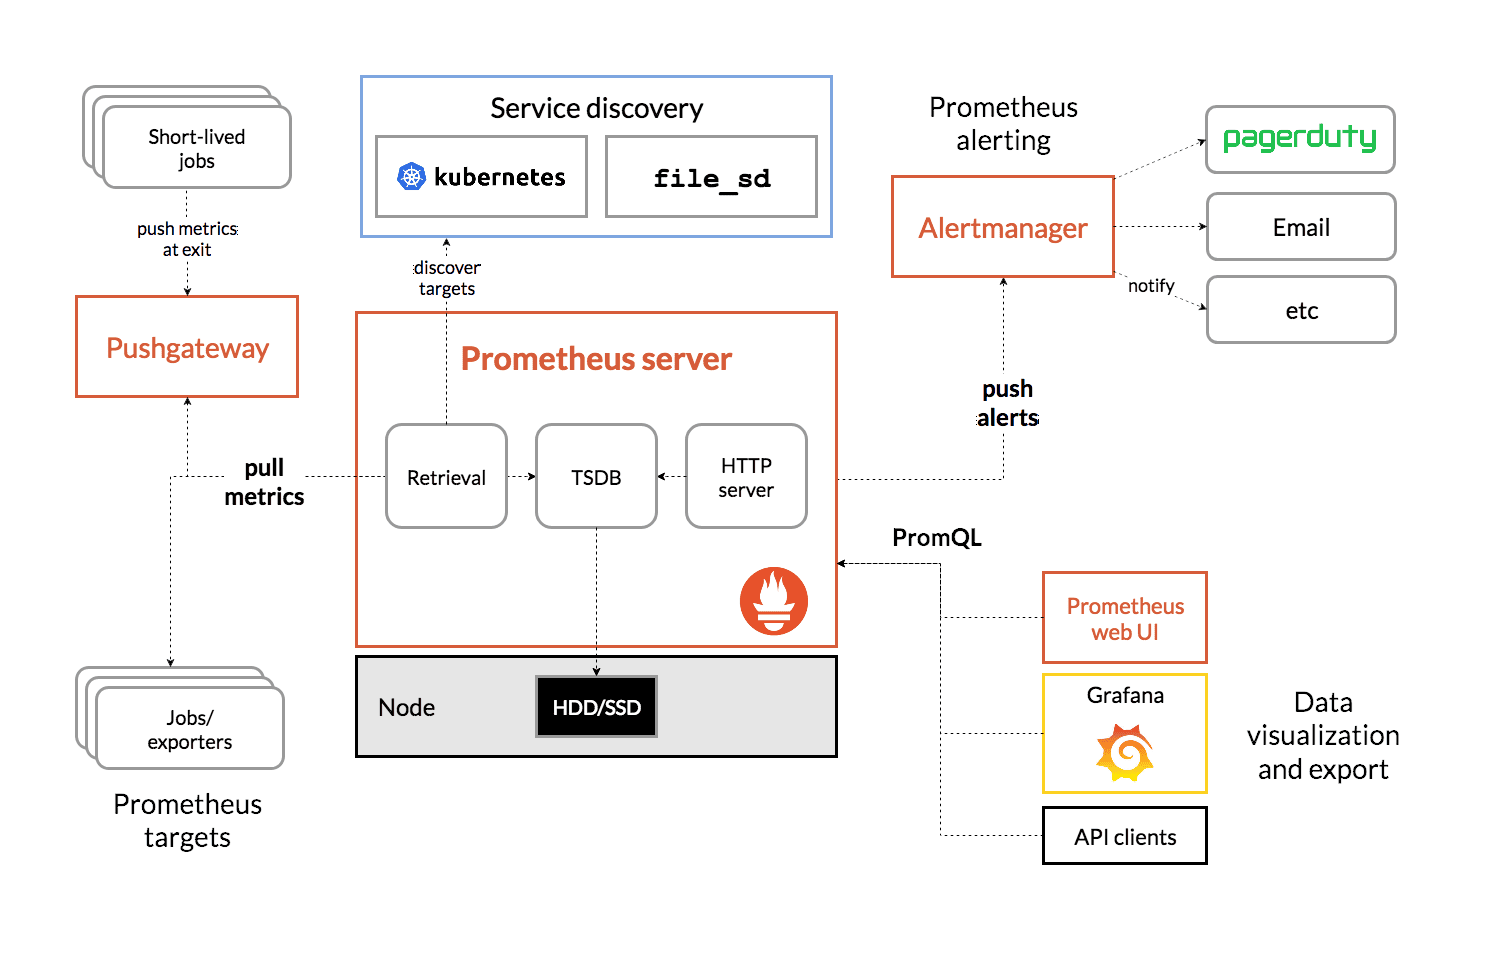
One of the most significant benefits of Prometheus is the broad ecosystem of open-source tooling built for it that works together tightly:
- Grafana is an open-source analytics and visualization platform. You can use it to see your Prometheus metrics associated with your Loki logs and your Tempo traces, and the UI makes it easy to query the data and share it or reuse it on custom dashboards. Additionally, there are pre-built Grafana dashboards for most of the data that you'll collect.
- Alertmanager allows you to set policies to define the alert conditions for your system, and route them to the systems that need to take action on those alerts. Importantly, these alerts are built from metrics tracked in Prometheus.
- Loki is a log aggregation system that helps you search, filter, and analyze logs. It can derive metrics from logs as they flow through and report them to Prometheus.
- Tempo is a distributed tracing system that helps you troubleshoot issues across your entire infrastructure.
- OnCall is a service management platform that helps you manage on-call schedules, incidents, and communication.
How it works
Prometheus uses a highly dimensional time-series data model, which means that you can track and analyze multiple dimensions of your infrastructure. For example, you can track the CPU usage, memory usage, and disk usage of your servers over time. You can also track the response time, error rate, and throughput of your services. This enables you to identify performance bottlenecks, troubleshoot issues, and optimize your infrastructure.
Prometheus discovers services to gather metrics on, and it regularly fetches metrics from those servers. The Prometheus server stores the metrics in a time-series database, and you can query and visualize the data using Grafana. PromQL is the query language used by Prometheus, and it allows you to filter, aggregate, and transform your data. With Grafana, you can create beautiful visualizations of your data, such as line charts, bar charts, and heat maps.
Getting Started
Getting started with Prometheus is relatively straightforward. The easiest way to get started is to use helm to install kube-prometheus-stack:
helm repo add prometheus-community https://prometheus-community.github.io/helm-charts
helm repo update
kubectl create ns monitoring
helm install prometheus prometheus-community/kube-prometheus-stack -n monitoring
After it's had time to install and come up a bit, you can check its status by just getting all the resources from the monitoring namespace:
kubectl get all -n monitoring
You should see some output like this:
NAME                                                         READY   STATUS            RESTARTS     AGE
pod/prometheus-prometheus-node-exporter-5dwfx                1/1     Running           0            30s
pod/prometheus-kube-prometheus-operator-6ddf989d68-rbddz     1/1     Running           0            30s
pod/prometheus-prometheus-kube-prometheus-prometheus-0       0/2     PodInitializing   0            17s
pod/prometheus-kube-state-metrics-5449b9d649-gp2gf           1/1     Running           0            30s
pod/prometheus-grafana-59bb456595-27hfj                      2/3     Running           0            30s
pod/alertmanager-prometheus-kube-prometheus-alertmanager-0   2/2     Running           1 (8s ago)   17s

NAME                                              TYPE        CLUSTER-IP      EXTERNAL-IP   PORT(S)                      AGE
service/prometheus-kube-prometheus-prometheus     ClusterIP   10.43.87.16     <none>        9090/TCP                     30s
service/prometheus-grafana                        ClusterIP   10.43.209.232   <none>        80/TCP                       30s
service/prometheus-kube-state-metrics             ClusterIP   10.43.29.1      <none>        8080/TCP                     30s
service/prometheus-kube-prometheus-alertmanager   ClusterIP   10.43.213.175   <none>        9093/TCP                     30s
service/prometheus-kube-prometheus-operator       ClusterIP   10.43.118.125   <none>        443/TCP                      30s
service/prometheus-prometheus-node-exporter       ClusterIP   10.43.22.58     <none>        9100/TCP                     30s
service/alertmanager-operated                     ClusterIP   None            <none>        9093/TCP,9094/TCP,9094/UDP   17s
service/prometheus-operated                       ClusterIP   None            <none>        9090/TCP                     17s

NAME                                                 DESIRED   CURRENT   READY   UP-TO-DATE   AVAILABLE   NODE SELECTOR   AGE
daemonset.apps/prometheus-prometheus-node-exporter   1         1         1       1            1           <none>          30s

NAME                                                  READY   UP-TO-DATE   AVAILABLE   AGE
deployment.apps/prometheus-grafana                    0/1     1            0           30s
deployment.apps/prometheus-kube-prometheus-operator   1/1     1            1           30s
deployment.apps/prometheus-kube-state-metrics         1/1     1            1           30s

NAME                                                             DESIRED   CURRENT   READY   AGE
replicaset.apps/prometheus-grafana-59bb456595                    1         1         0       30s
replicaset.apps/prometheus-kube-prometheus-operator-6ddf989d68   1         1         1       30s
replicaset.apps/prometheus-kube-state-metrics-5449b9d649         1         1         1       30s

NAME                                                                    READY   AGE
statefulset.apps/prometheus-prometheus-kube-prometheus-prometheus       0/1     17s
statefulset.apps/alertmanager-prometheus-kube-prometheus-alertmanager   1/1     17s
Now let's check out prometheus:
# I'll port-forward to its web interface on localhost:9090
kubectl port-forward service/prometheus-kube-prometheus-prometheus -n monitoring 9090:http-web
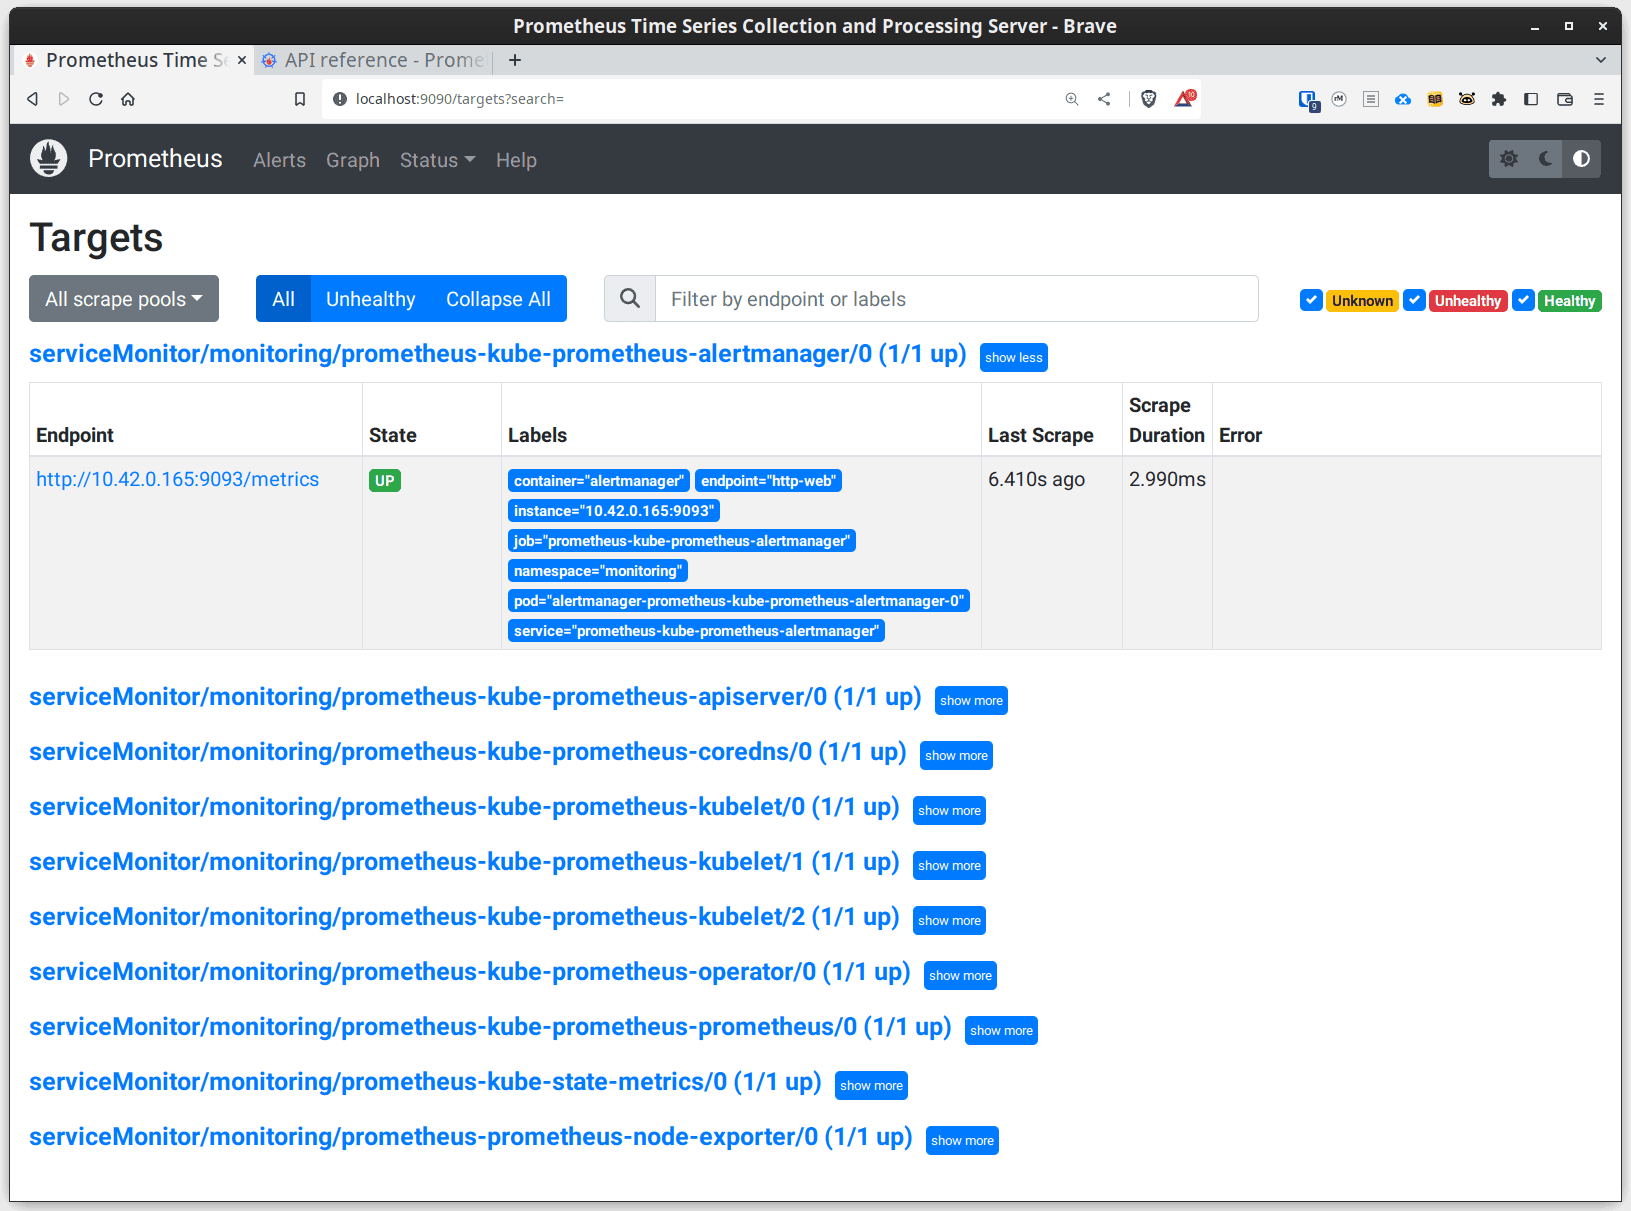
Now if you visit http://localhost:9090/targets you can see all of the targets that prometheus has discovered and is scraping. With the prometheus operator, you can publish a ServiceMonitor and your prometheus instance will discover and begin scraping the specified service. It's incredibly easy to maintain the monitoring targets via gitops.

You can visit http://localhost:9090/alerts to view the current status of the alerts in Alertmanager:
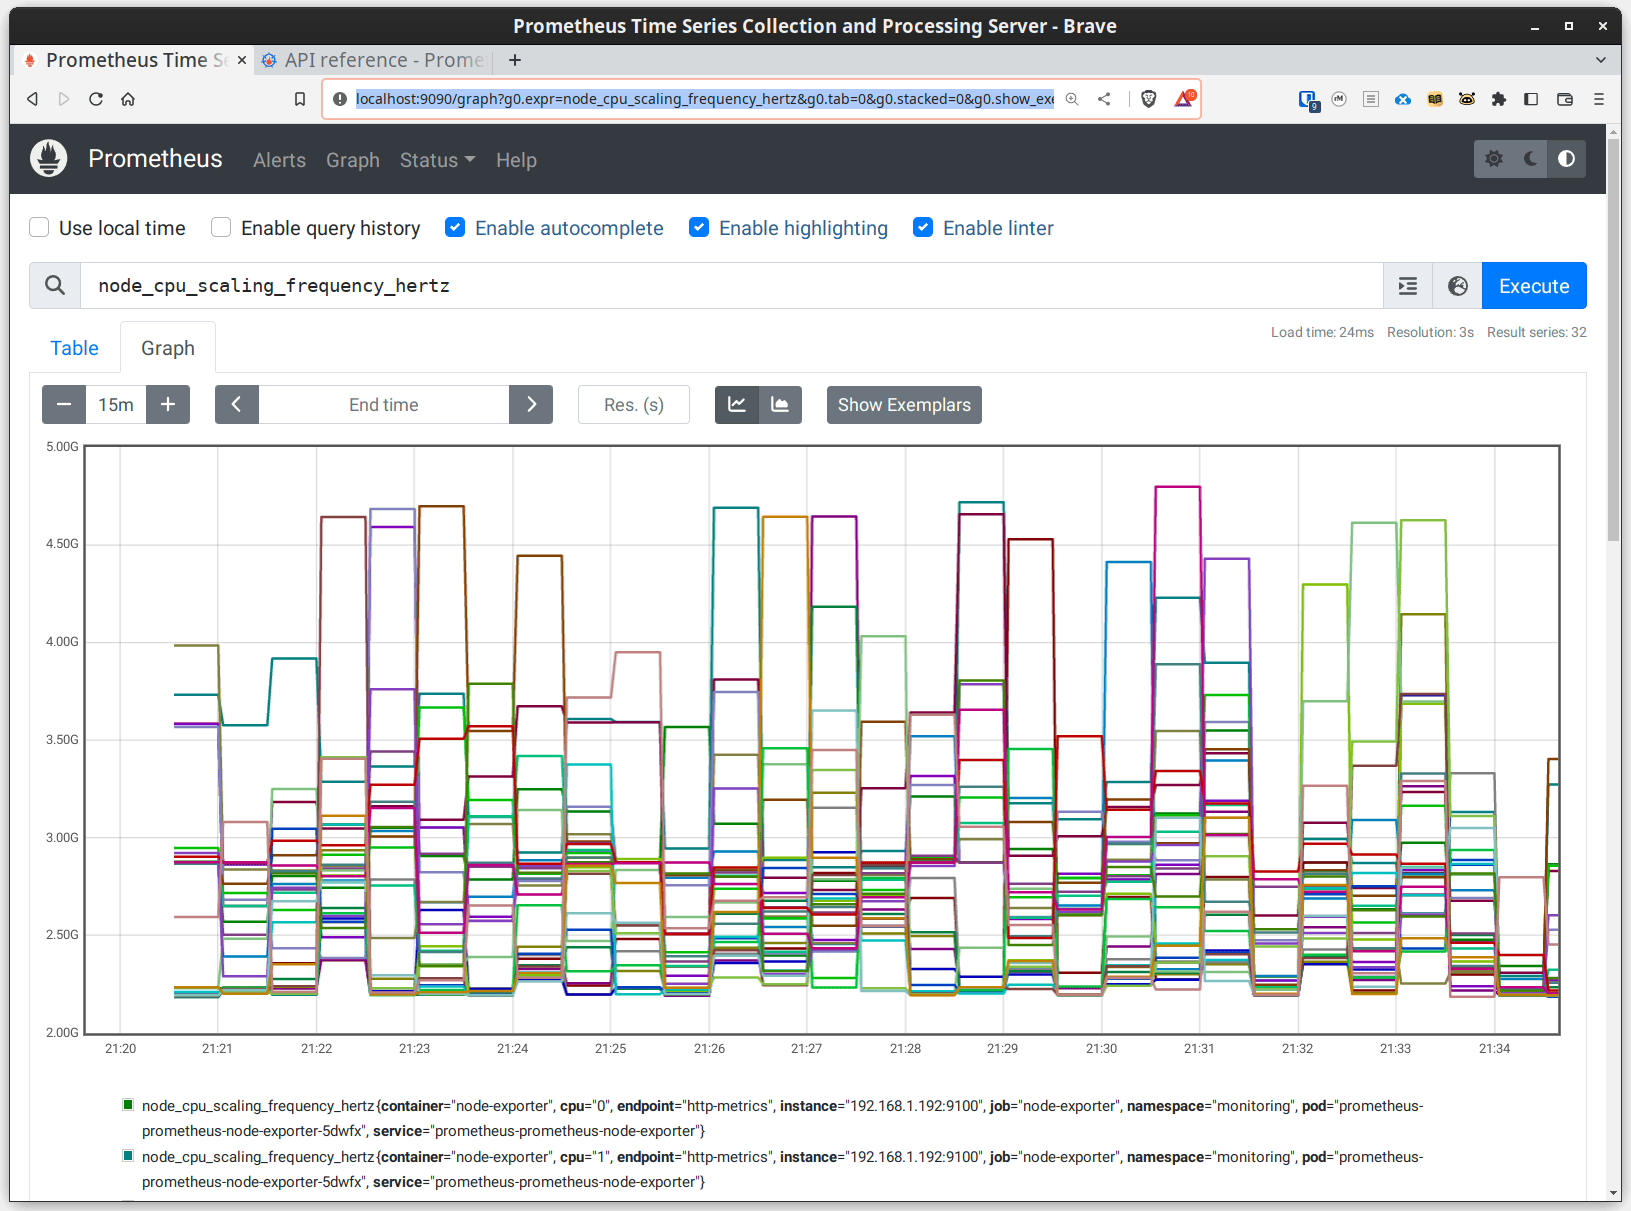
But the real fun comes in graphing when it comes to metrics, of course, so here's a graph of each core's scaling frequency
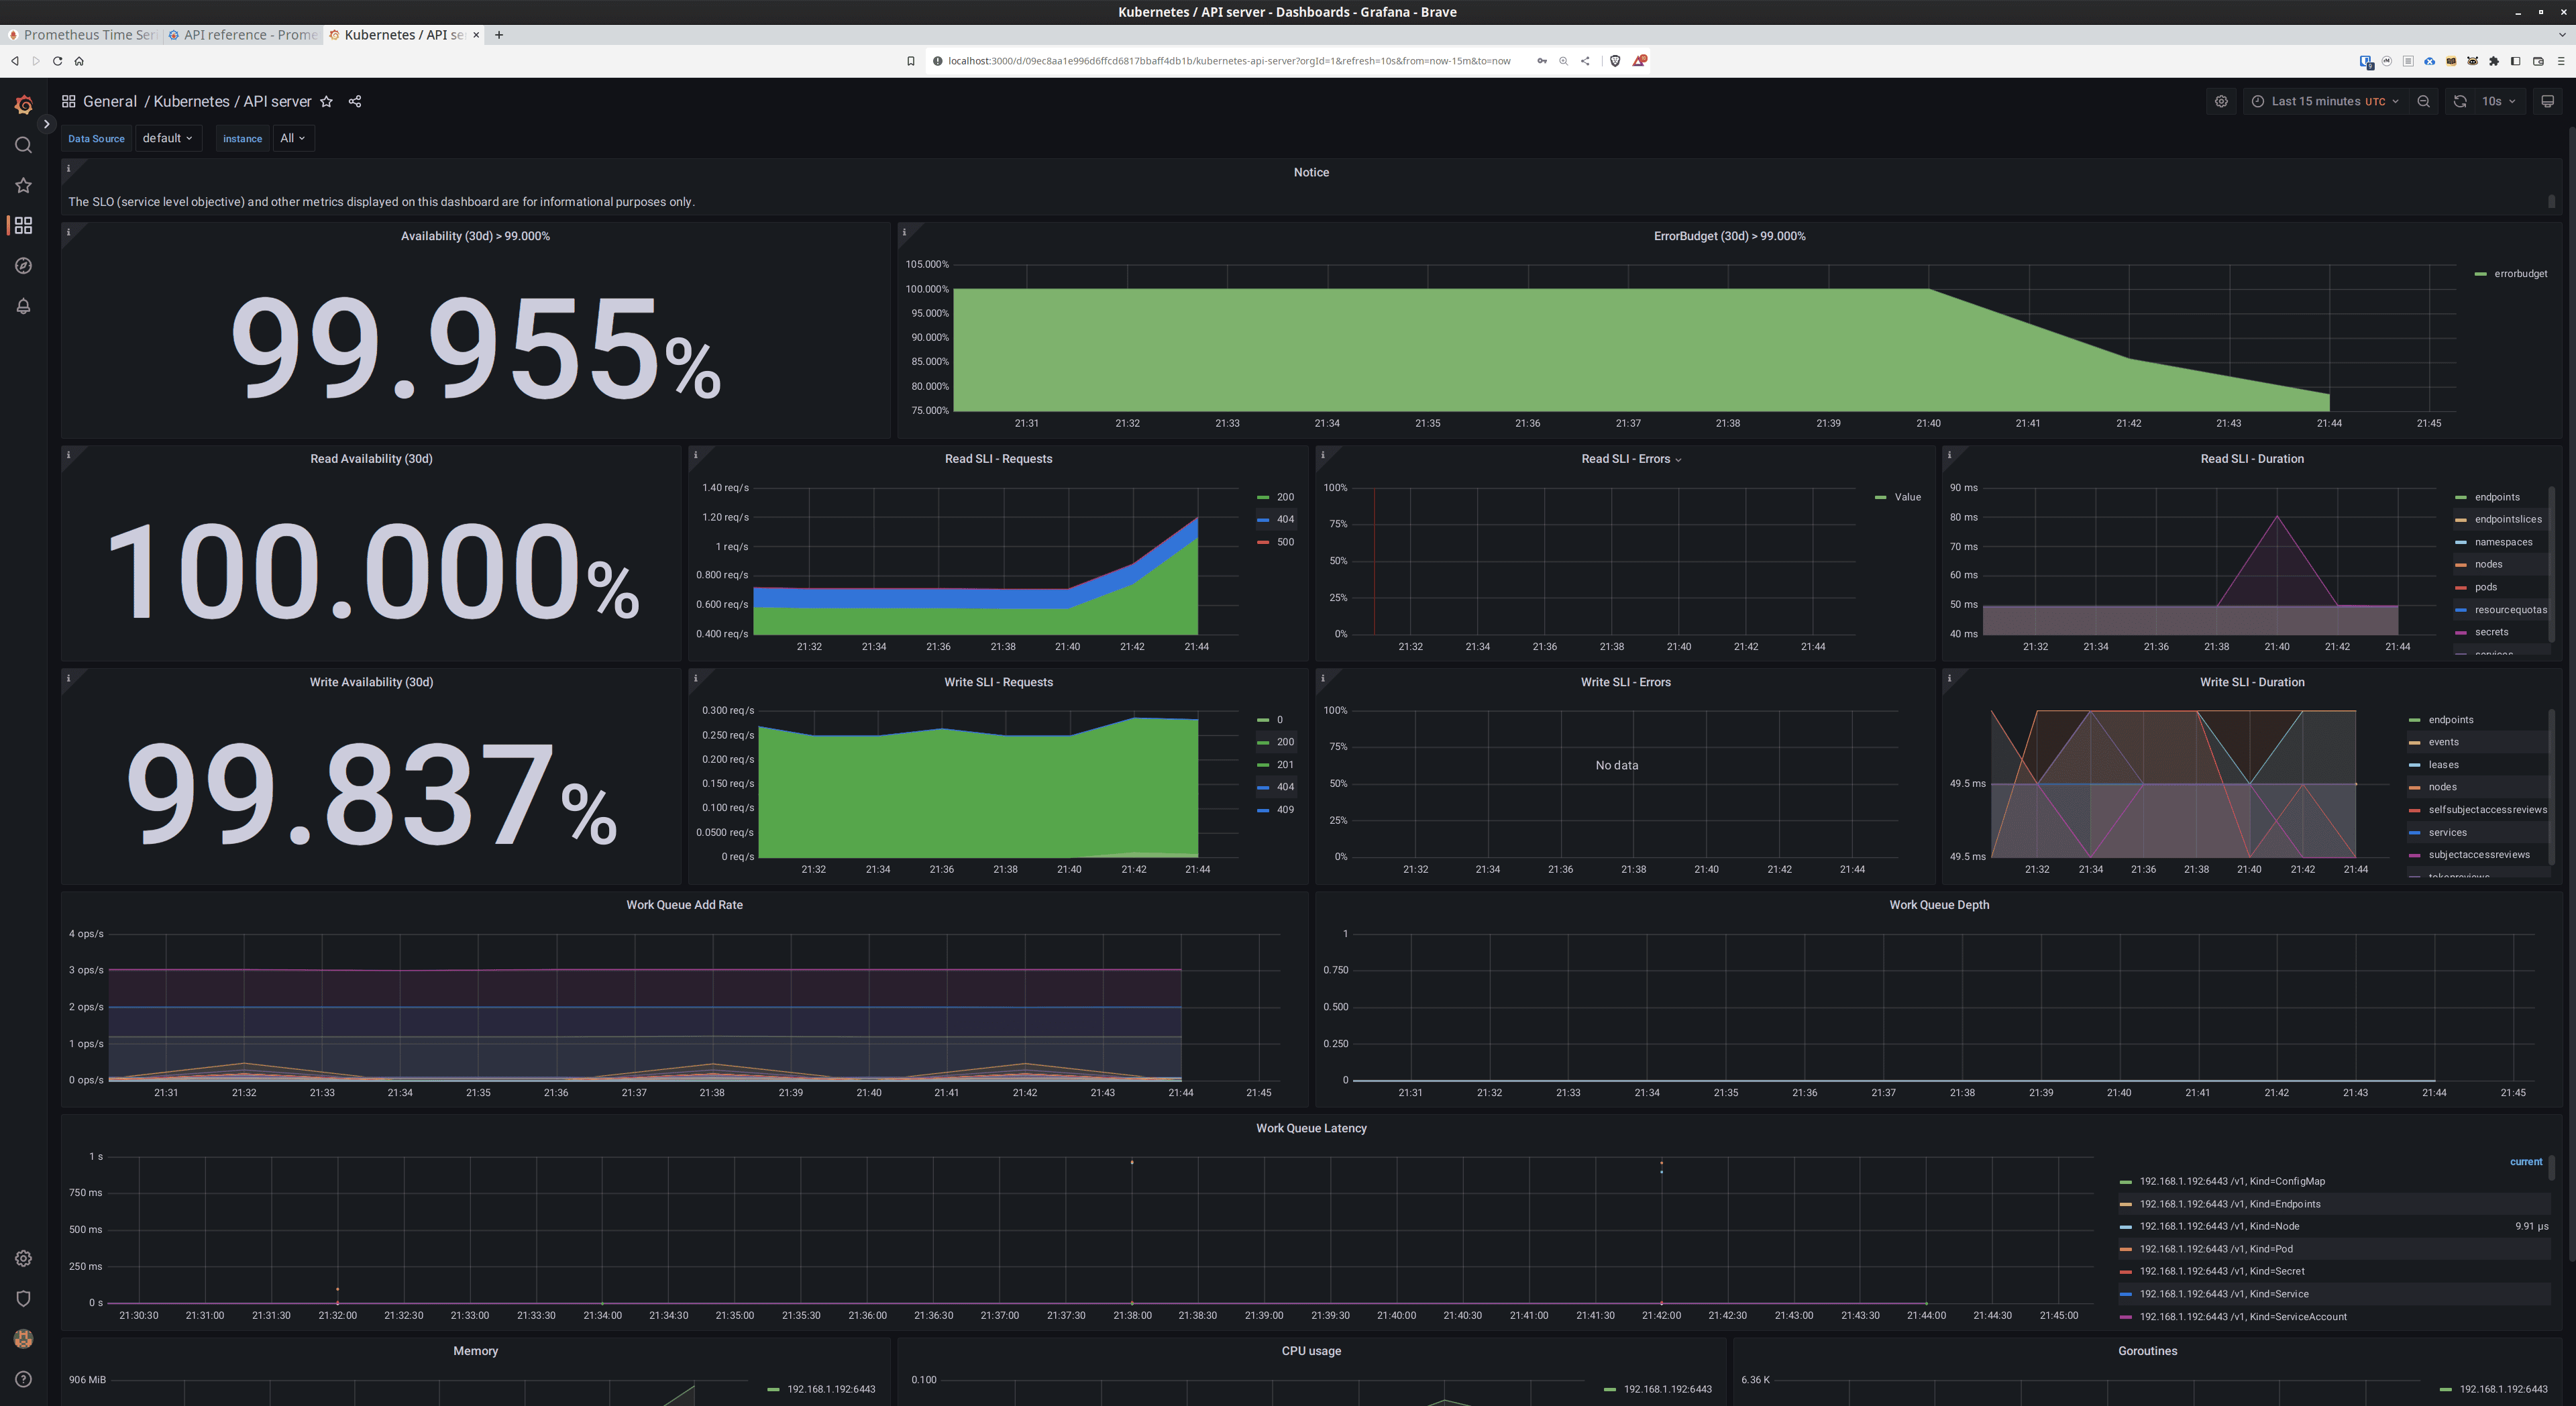
Bonus: You've actually got a grafana available to play around with as well, as part of the kube-prometheus-stack. You can port-forward to it and dig around - we'll have another post digging into Grafana in detail soon.
# Get the grafana admin password secret
kubectl get secrets -n monitoring prometheus-grafana -ojsonpath='{.data.admin-password}' | base64 -d
# Port forward to grafana
kubectl port-forward service/prometheus-grafana -n monitoring 3000:http-web
Now you can log in with the username admin and the password you got in the previous step, and browse a bunch of great dashboards.
Summary
In conclusion, Prometheus is a powerful monitoring tool that can help you measure and improve your business operations. It allows you to gather data across all of your services, track multiple dimensions of your infrastructure, and visualize your data using Grafana.
However, setting up and managing Prometheus can be challenging. That's where managed Kubernetes services like Kolony can help. Kolony provides managed Kubernetes services that include Prometheus monitoring. We can help you get the most out of Prometheus by handling the setup, management, and monitoring of your infrastructure. Contact us today to learn more about how we can help you measure and improve your business operations.
Resources
